Metrics
Creating CloudWatch Metric Filters
You can use metric filters to monitor events in a log group as they are sent to CloudWatch Logs. You can monitor and count specific terms or extract values from log events and associate the results with a metric. In this section, we will manually create a Metric Filter to show access denied errors found in CloudTrail.
- Go to the CloudWatch console
- Select the CloudTrail Log Group we created in the setup.
- Once selected, click Actions and Create Metric Filter.

- In the Filter pattern field, copy and paste the following query.
{$.errorCode = "ValidationException" || $.errorCode = "AccessDenied"} - Select log data to test from dropdown: Such as accountid_CloudTrail_region (123456789012_CloudTrail_us-east-1)
- Click on Test Pattern to make sure the filter is working.
- Click Next.
- In the Create Metric Filter and Assign a Metric page, enter the following values.
- Filter Name: errorCode-ValidationException-and-AccessDenied
- Metric Namespace: LogMetrics
- Metric Name: AccessError
- Metric Value: 1
- Click Next and Create metric filter
Graphing CloudWatch Metric Filters
In the previous section, we created a Metric Filter from the CloudTrail events in CloudWatch Logs. In this section, we will visualize the data in a graph based on that filter.
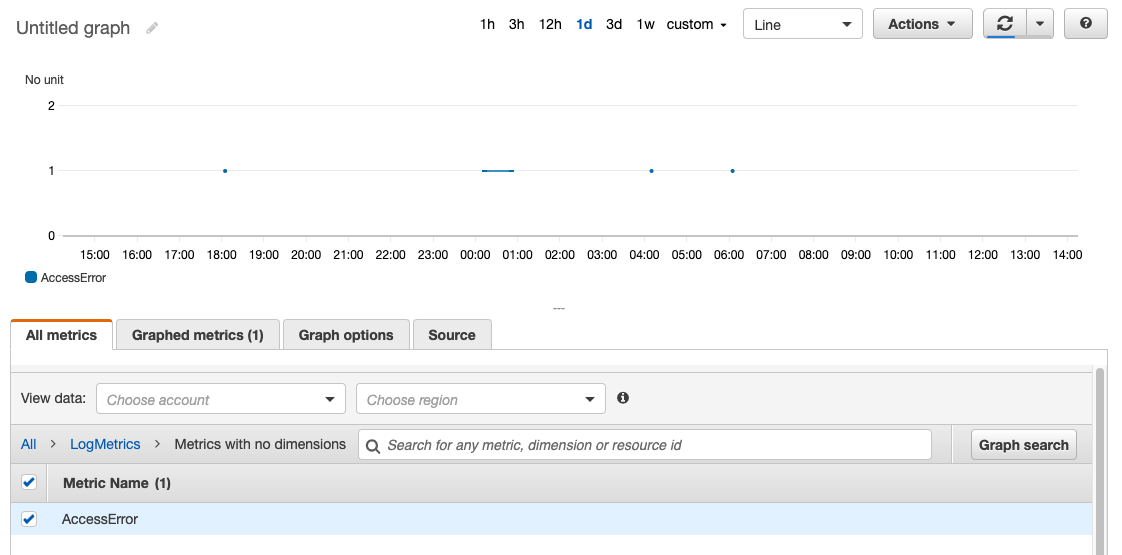
- Go to the CloudWatch Metrics console.
- On the All metrics tab Select LogMetrics.

- Click on Metrics with no dimensions.
- Check the AccessError check box.
- Make sure 1d is selected for the time span.
In the graph, we will see the activity related to the access denied errors found in the CloudTrail events of the CloudWatch Log Group.