Cloudwatch Logs Insights
CloudWatch Logs Insights enables you to interactively search and analyze your log data in Amazon CloudWatch Logs. You can perform queries to help you more efficiently and effectively respond to operational issues. If an issue occurs, you can use CloudWatch Logs Insights to identify potential causes and validate deployed fixes.
CloudWatch Logs Insights includes a purpose-built query language with simple but powerful commands. CloudWatch Logs Insights provides sample queries, command descriptions, query autocompletion, and log field discovery to help you get started. Sample queries are included for several types of AWS service logs.
If you skipped the setup section or didn’t take note of the URL earlier:
• Click here or:
• Navigate to the AWS Console
• Start typing CloudFormation in the AWS Services search box
• Select CloudFormation
• You should see multiple stacks, some of which are nested
• Click on the primary stack (the only one without NESTED written next to it)
• Navigate to the Outputs tab and open the SampleAppUrl in a new tab
-
Generate sample logs
- Navigate to the SampleAppUrl
- Locate the lines labeled “Generate Some Sample Logs Here”, and “Simulate high error logs Here”. These links will generate sample log entries. Click both links a few times to generate a sample of logs.
-
Finding log groups in CloudWatch Logs
- In your AWS Console, navigate back to CloudWatch
- From the navigation menu on the left, click on Log Groups under the Logs headings.
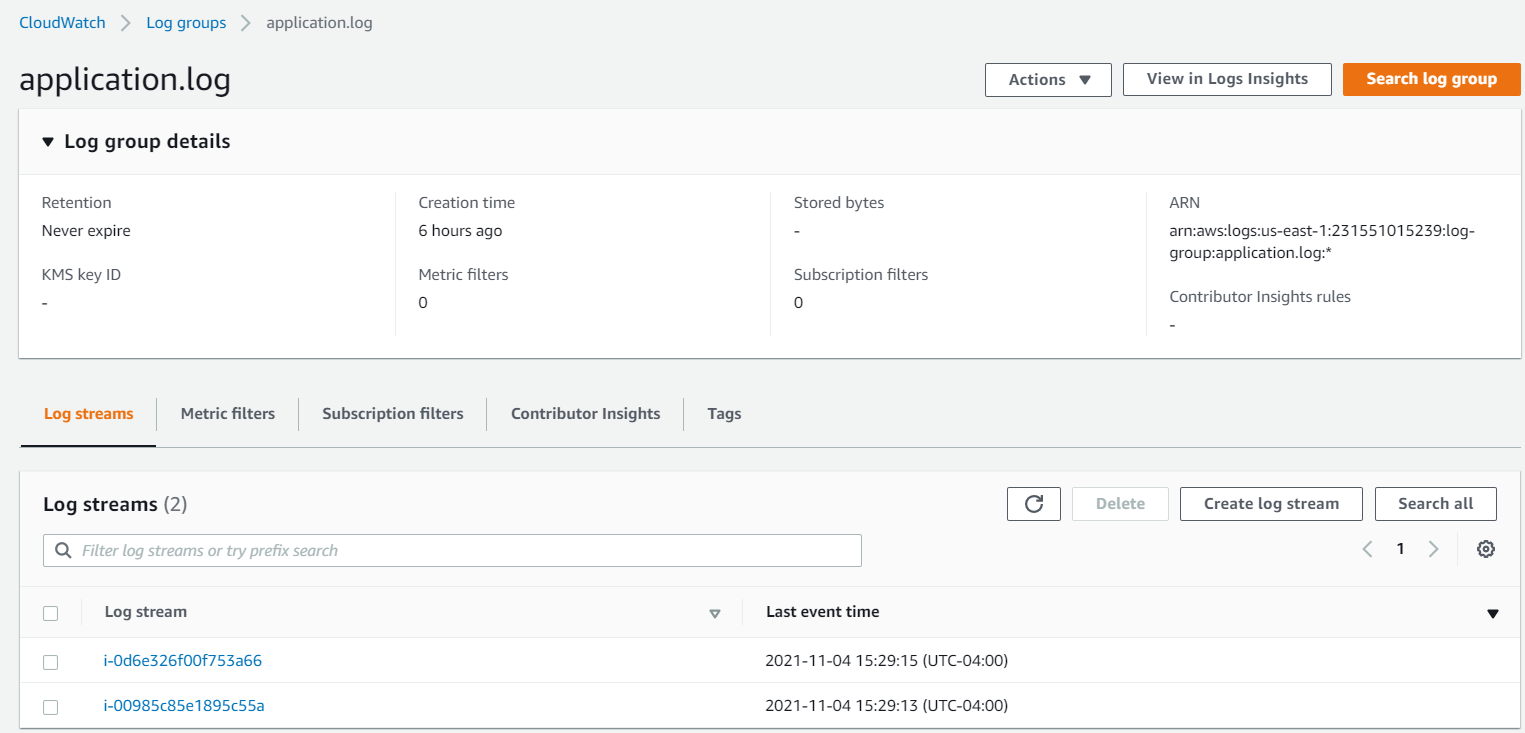
- Search for the Log Group titled application.log, this is where our sample logs should land, click this log group to bring up the details.
*It might take a minute or two for the logs to arrive, if you do not see them, wait a few minutes and check back. If several minutes have passed there might be an issue with the CloudWatch logs agent on your instances.
Your screen should look similar to what’s below:

- Click on one of the log streams to validate your sample log entries have landed, you can view the raw log entries here:

-
Querying log groups via CloudWatch Logs Insights
- Now let’s take advantage of some of the more advanced log analytics offered by Log Insights. Return to the previous screen and click the button View in Logs Insights
- Using the default which is supplied in the query window, hit the button to Run Query
- You should see some results, depending on how many logs you’ve generated. If you don’t see anything, try adjusting the timeframe, or wait a few minutes for the logs to ingest.

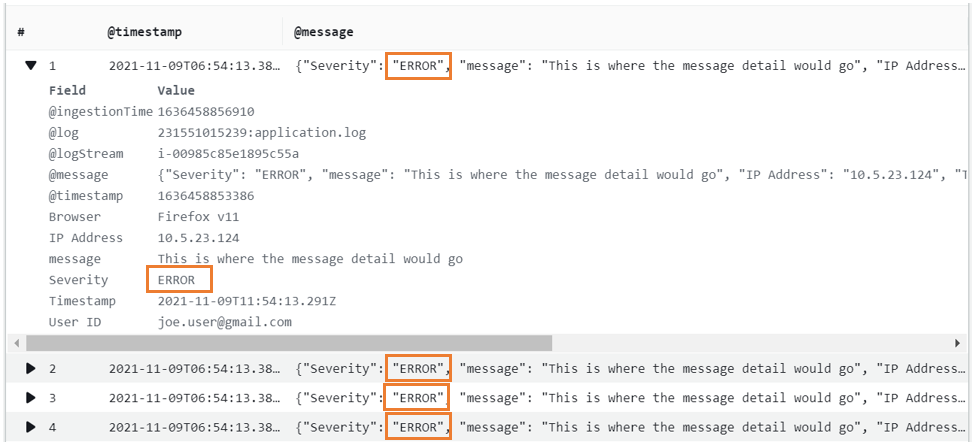
- We can add some filtering to narrow down the results. Try the query below to identify error records:
    fields @timestamp, @message
    | filter Severity="ERROR"
`
- Now you can investigate the errors:

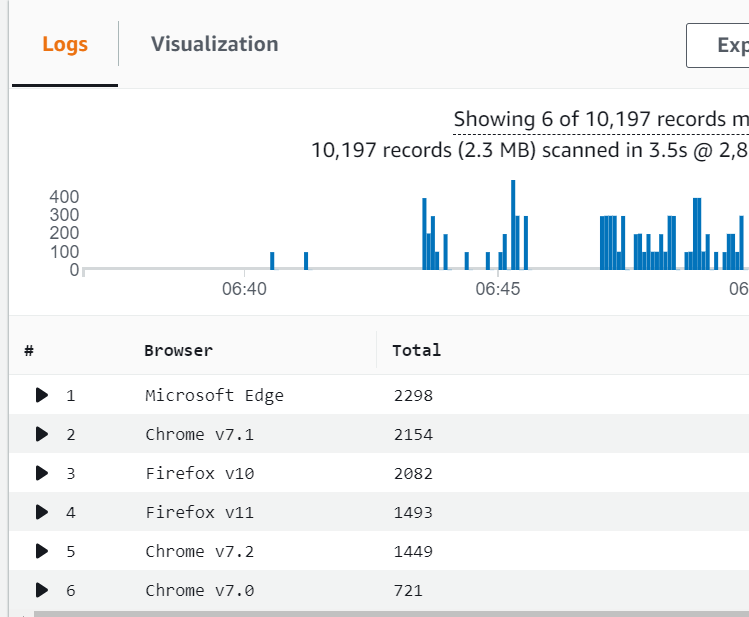
- You can use statistical functions to aggregate the results. Try the below query to summarize the log events byt Browser type:
fields Browser
| stats count(*) as Total by Browser
| sort Total desc
`
- You should see the raw data in table format

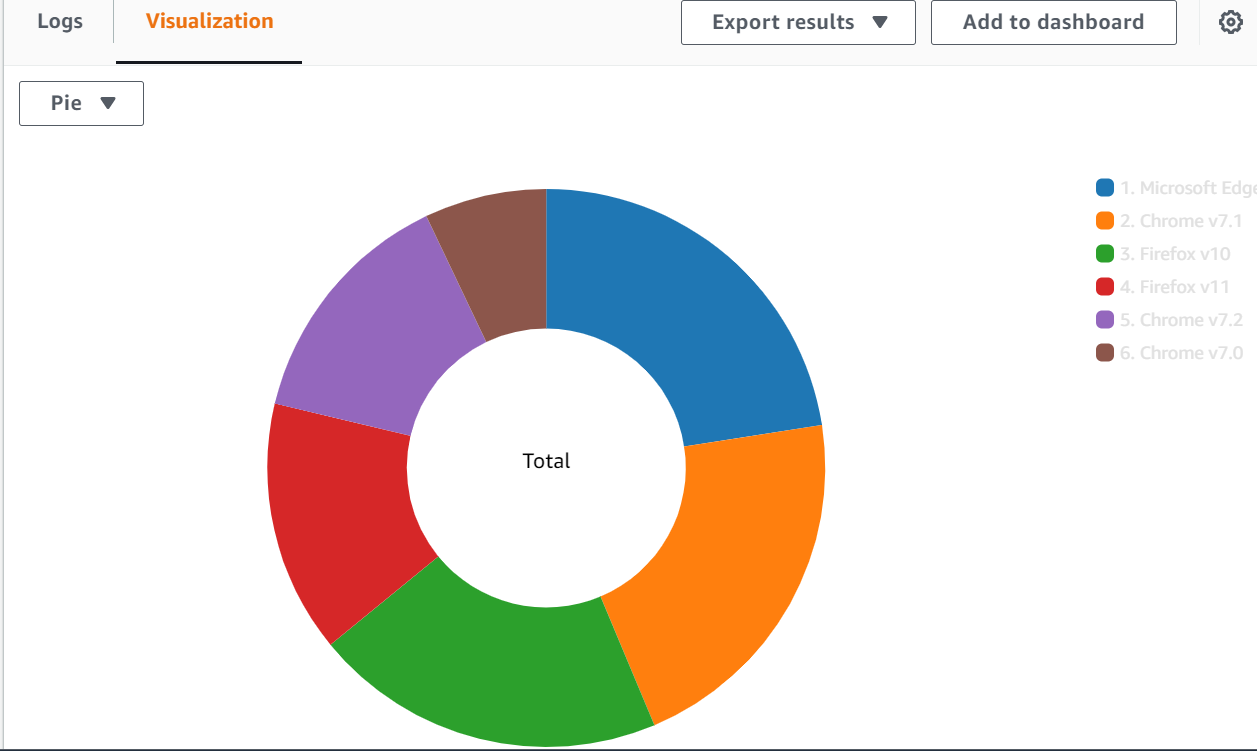
- Click the visualization tab to display in graphical format. Pick Pie chart from the dropdown:

- Parsing is a powerful feature which can be used to extract additional data from within fields. Try the below parsing example using a regular expression to extract the domain from a user’s email.
parse `User ID` /(?<domain>.(?<=@)[^%]+)/
| stats count(*) by domain
`
- You can see which email domain your end users are coming from:
